Running and debugging
Keep program output beside the source, use a shell for project commands, and attach a debugger when you need to stop and inspect execution.
Compile, make, run
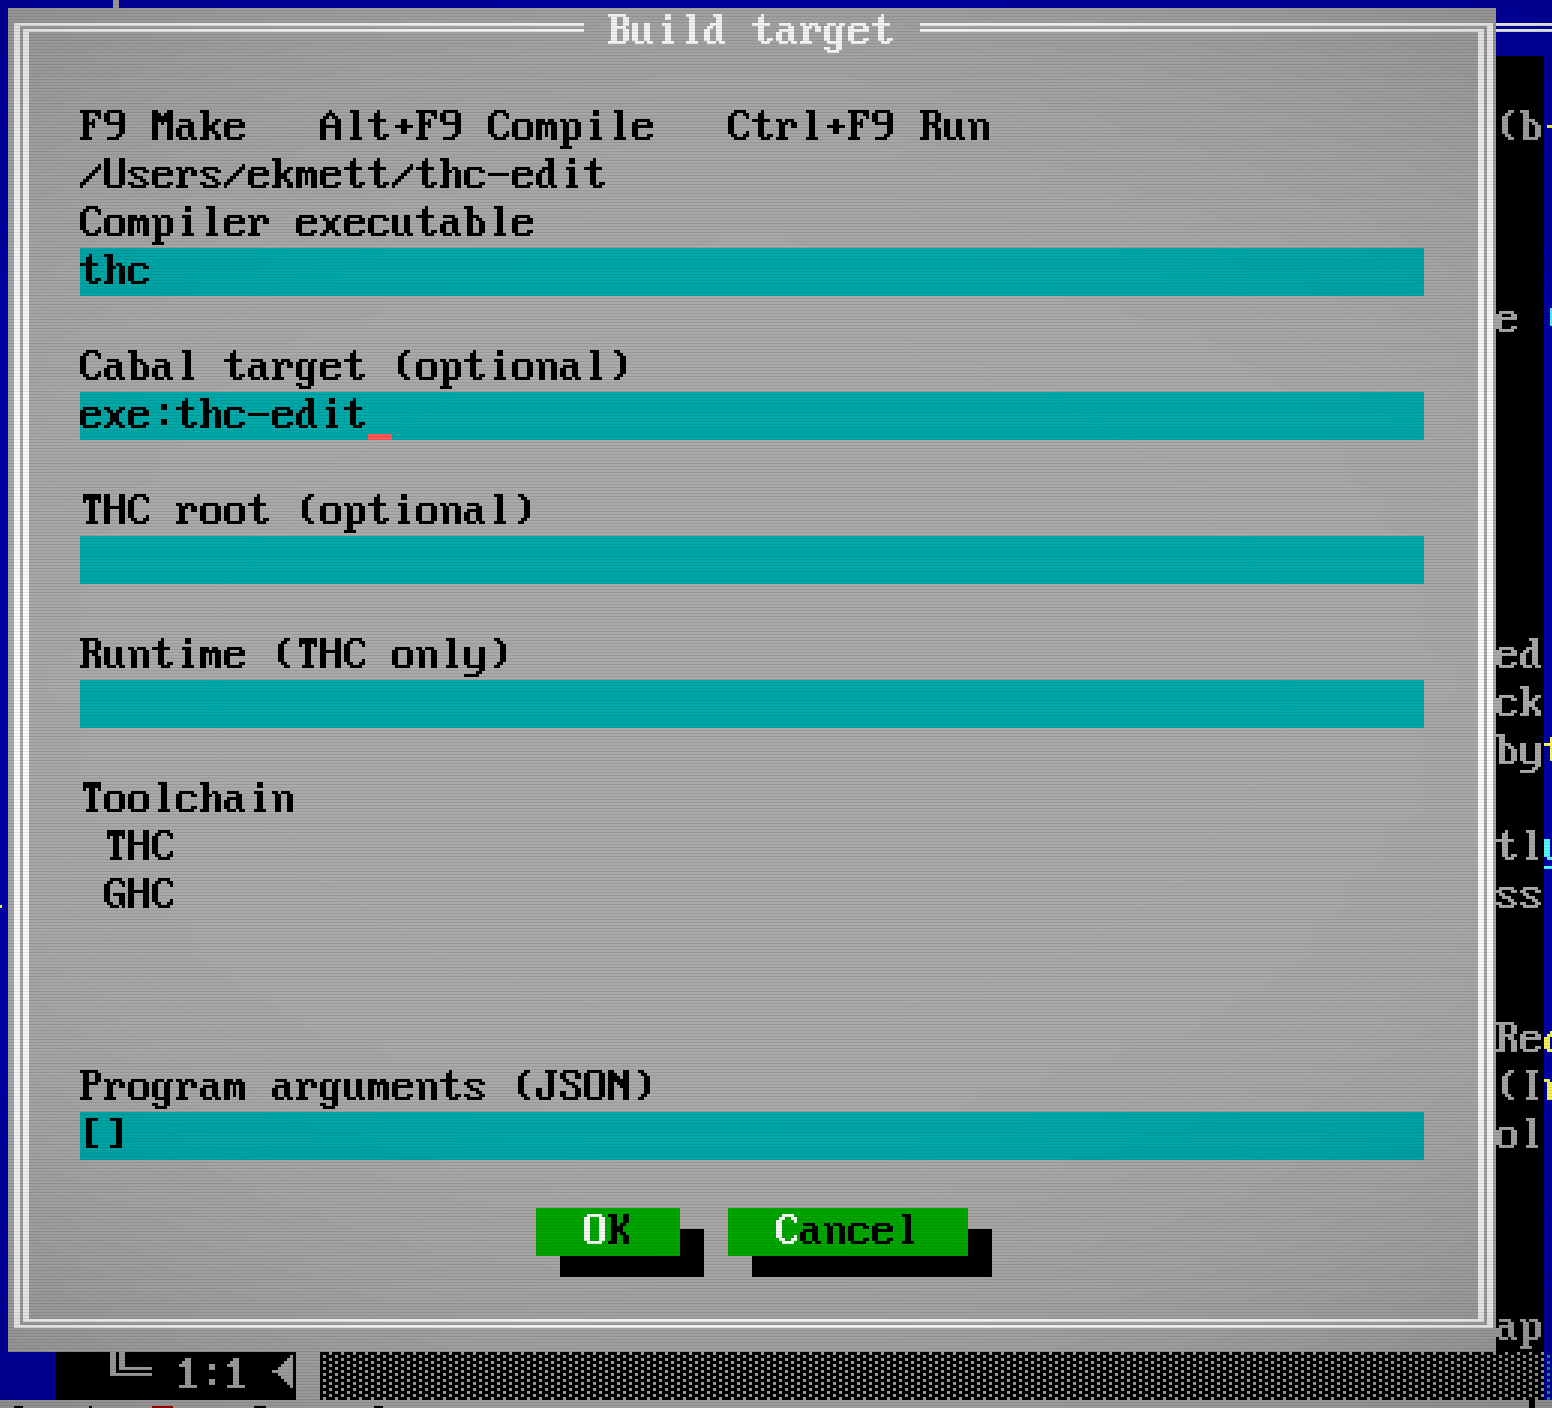
Choose Run > Target (also Compile > Target) to select THC or GHC, the compiler executable, and an optional Cabal target such as package:exe:program. Save your source files, then use:
| Action | Windows/Linux | Mac | What it does |
|---|---|---|---|
| Compile | Alt+F9 | ⌥F9 | Compile the selected package target; check a standalone GHC source file |
| Make | F9 | F9 | Build the selected package target or standalone executable |
| Run | Ctrl+F9 | ⌃F9 | Build and run the selected program |
On Mac, hold Fn or the Globe key as well if the function keys control media or hardware settings. Ctrl and Alt shortcuts below mean ⌃ Control and ⌥ Option, respectively; Command is not a substitute.
These actions are also clickable in the ordinary status bar. Compile and Make open an output window; output arrives while you keep editing. Compiler errors and warnings appear in Messages, where Alt+F8 and Alt+F7 move between source locations. Compile > Stop build stops the current job.
For THC, Compile and Make invoke thc build: Cabal builds the selected component and THC acquires its dependency Core. Leave the target empty to build the current package, or name a Cabal library or executable target. Run invokes thc run, which selects a runnable component and acquires anything it needs. Use a THC version with the build command. For GHC projects, the editor uses cabal build and cabal run with the selected compiler. Outside a Cabal project, Compile checks the current .hs or .lhs file with ghc --make -fno-code, Make compiles the module (and links an executable for Main), and Run uses runghc with the selected GHC.
The target dialog also accepts an optional THC root and runtime path, and program arguments as a JSON array, for example ["input.txt", "--verbose"]. Arguments go directly to the process; shell syntax is not interpreted. Settings live in the user configuration directory. The Cabal target belongs to the selected project, while the compiler installation is shared.
Run uses an embedded terminal when the terminal build is available. Basic builds capture output without interactive input; Run > Stop build/run stops a captured run. All commands execute on the session host, including over SSH. Detaching the display leaves an active build or run intact.
Shells and output
File > Terminal opens the configured shell in the project directory. Ordinary keys and paste go to the focused terminal. Ctrl+C interrupts its foreground job; raw-mode programs receive the control byte themselves. F5, F6, F10, numbered-window shortcuts and menu controls stay with the editor. Resizing the terminal window resizes its PTY; output supports colors, attributes and Unicode.
Click the terminal title bar's cyan [ ] control, or choose Window > Pin / unpin terminal, to dock it at the bottom. Messages and pinned terminals share one panel with tabs. Click a tab or use the existing numbered-window/F6 shortcuts to focus a terminal; hidden tabs keep receiving output. Drag an unused part of the panel's top border to resize the shared panel. The cyan [P] control restores the terminal's floating window, constrained to the current screen and Files panel. Pinning preserves the process, window number, buffer and selection. Tile and Cascade arrange the floating windows only.
The Messages collapse arrow hides its tab; pinned terminals keep the panel open. A recovered checkpoint retains these tabs as Ended Terminal views without restarting their processes.
Closing a terminal window leaves its command running. Run > Stop terminal stops the selected process. File > Exit cleans up the session's terminal processes. Detaching the frontend leaves them running; return with --resume. ACP terminal requests use the same backend, with approval before execution.
Launch or attach a debugger
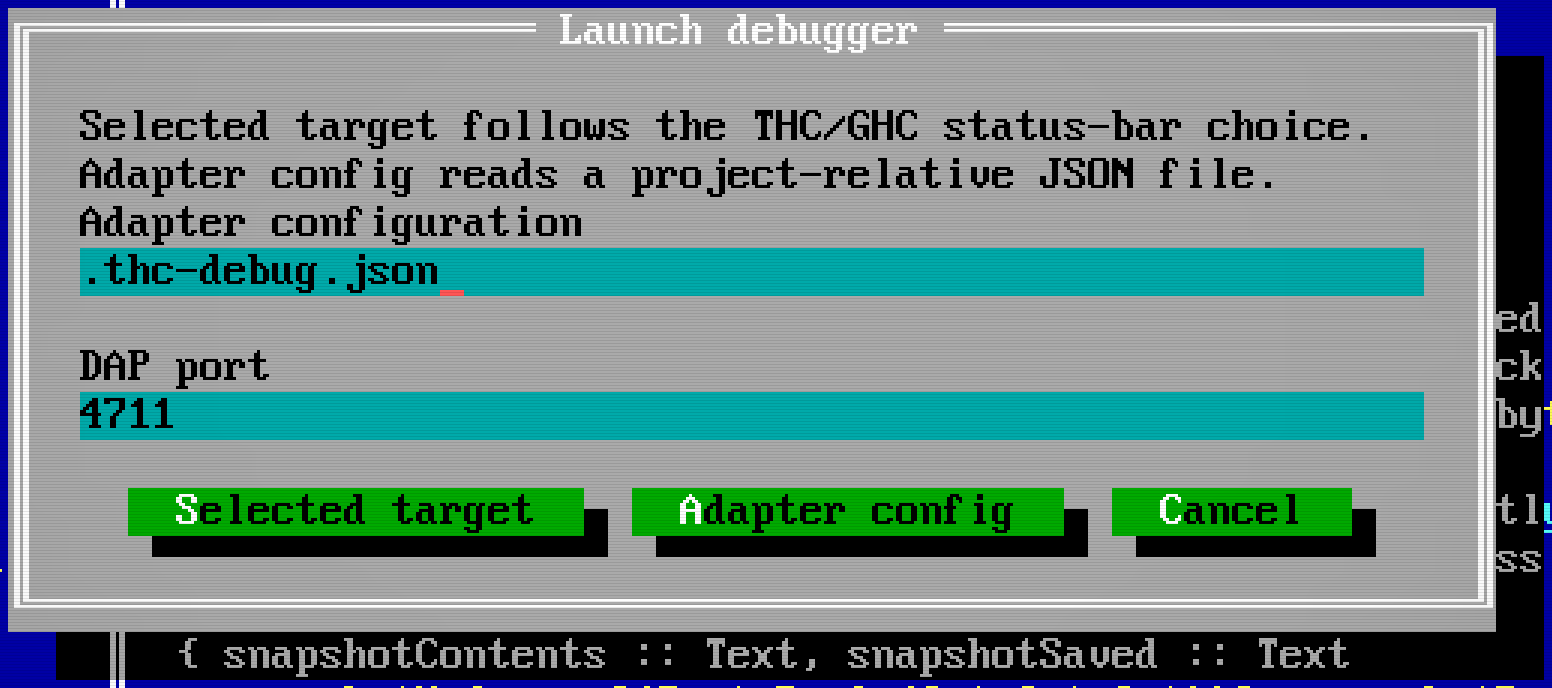
Debug > Launch offers Selected target and Adapter config. With THC selected, Selected target uses the THC installation and package selected in Run > Target. Choose an unused loopback port (default 4711); the editor starts thc run --dap-port PORT, waits for its debugger, and configures your breakpoints before execution. This requires a THC build with the DAP instrument and --dap-port support. THC's DAP launch defaults to waiting for attachment and suspending initially. Build output is available in Debug > Output while it starts. The first launch can spend several minutes building and capturing dependencies. Debug > Disconnect stops that work; protocol response timing starts when the debugger connects.
THC initially stops at an instrumented source location. Embedded source opens read-only, where Ctrl+F8 sets a breakpoint in the running program. Both the AST and bytecode runtimes carry source locations; optimized Core can repeat or combine locations, so a step need not advance to a different line. Scopes and values depend on the runtime: THC source stepping is available, while lexical scopes and value inspection remain runtime work.
For another debugger, put its command and DAP arguments in .thc-debug.json in the project directory, or choose another configuration path:
{
  "command": ["lldb-dap"],
  "request": "launch",
  "arguments": {"program": "/absolute/path/to/program", "args": []}
}
The adapter owns the meaning of arguments. Use "request": "attach" for an adapter-specific attach configuration. A TCP configuration replaces command with "host": "127.0.0.1", "port": 4711; only loopback endpoints are accepted. Adapter commands and arguments are passed without a shell.
For GHC debugging, install hdb built for your GHC version and use an owned TCP server configuration. This example runs main from Main.hs:
{
  "server": ["hdb", "server", "--port", "4711"],
  "host": "127.0.0.1",
  "port": 4711,
  "adapterId": "hdb",
  "request": "launch",
  "arguments": {
    "projectRoot": "/absolute/canonical/path/to/project",
    "entryFile": "Main.hs",
    "entryPoint": "main",
    "entryArgs": [],
    "extraGhcArgs": []
  }
}
Choose Debug > Launch > Adapter config. The editor starts hdb in the project directory, sets DAP_HOST and DAP_PORT in that child process, and connects when its loopback listener is ready. The server command's port must match the configuration. Existing listeners are rejected before spawning. Owned server startup has a five-minute deadline; a DAP launch request has two minutes for loading/compiling the project. Ordinary requests retain their 15-second deadline. Use Debug > Disconnect to cancel startup or stop the owned session.
hdb uses your project's cradle to load the entry module. Use the canonical project path (resolving symlinks) and an entry file belonging to that cradle. Once stopped, use the same breakpoints, stepping, call stack and scopes as THC. Lazy values are displayed without forcing them; ordinary expansion refuses a lazy handle. hdb remains an external tool, with no GHC API dependency in the editor.
Debug > Attach connects directly to an already-running DAP endpoint, defaulting to 127.0.0.1:4711. The debugger protocol stays separate from program output. Disconnecting an attached session requests that its program remain running; the adapter determines whether detach is supported. disconnecting an editor-launched session requests termination and releases its owned adapter. Detaching the editor display preserves the debugger, so --resume returns to the same breakpoints and stopped state. With THC, continuing to normal termination avoids a known early-detach shutdown race in the Graal DAP instrument.
The status bar's THC ▼ / GHC ▼ menu switches the toolchain used by Compile, Make, Run and Debug > Launch > Selected target. The choice is saved with independent settings for each toolchain. A new choice starts with the standard thc or ghc executable; switching back restores its compiler and target. Target settings… lets you change them. Other open sessions refresh the global selection. Running sessions keep their current toolchain until you launch again.

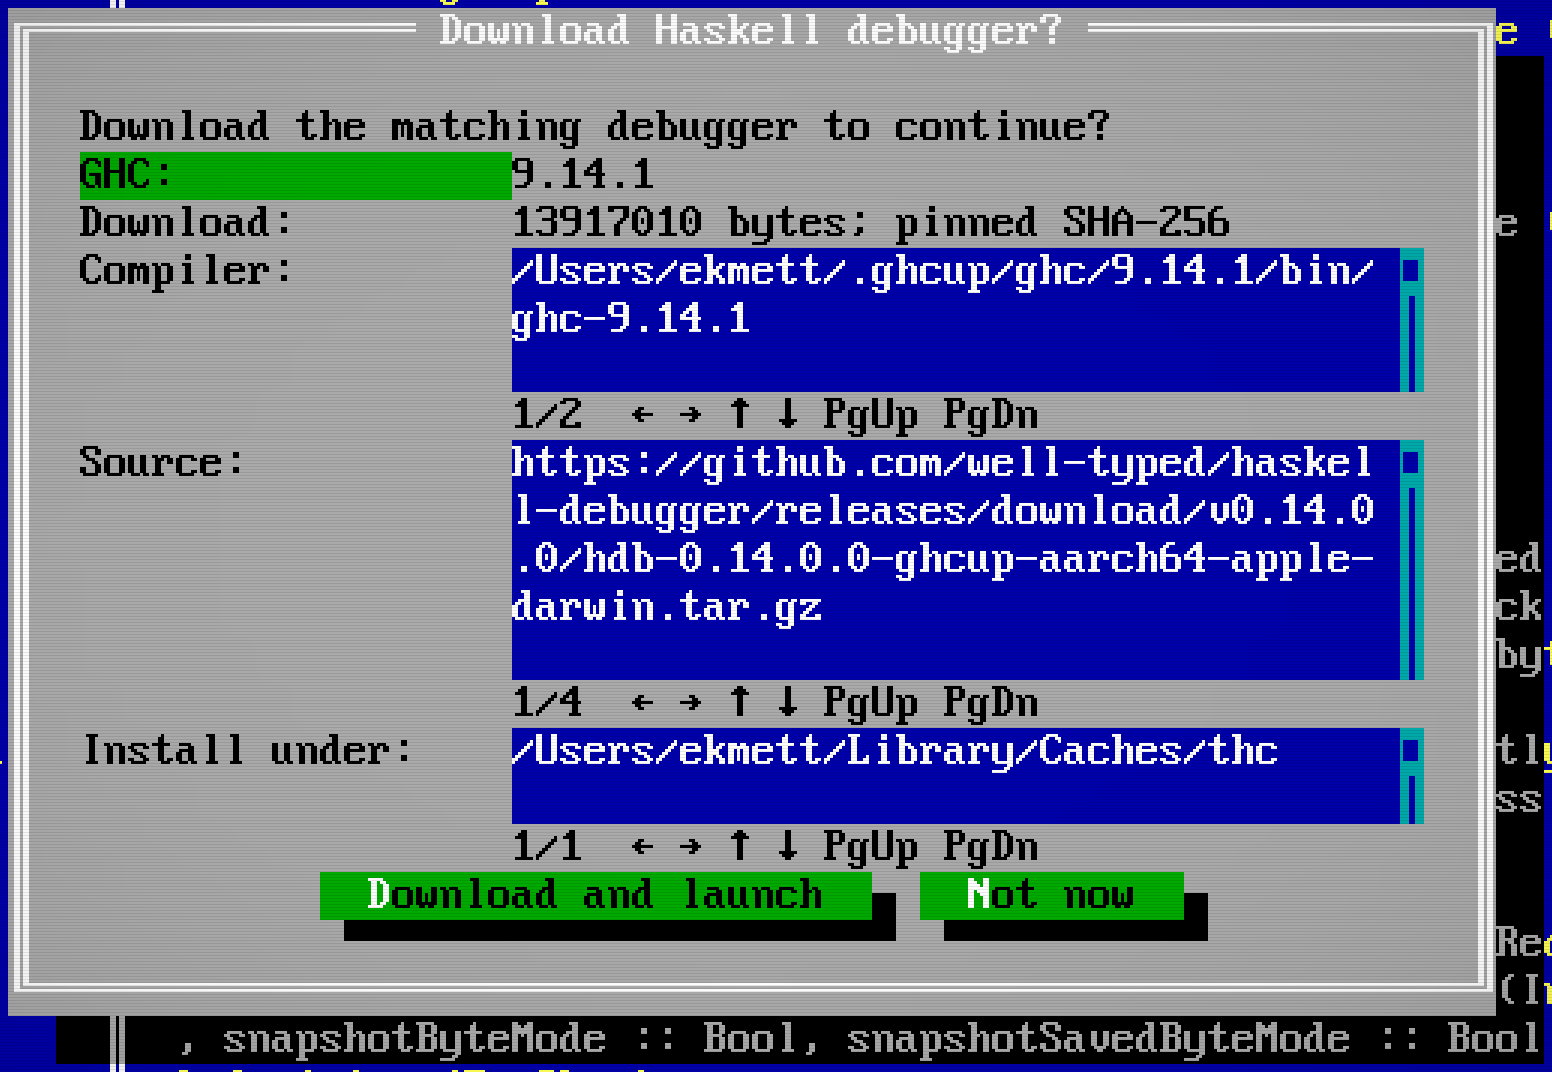
With GHC selected, open the saved Haskell entry file and choose Selected target to run its main through a matching hdb. Program arguments come from Target settings. Existing hdb-<GHC version> or hdb executables on PATH take precedence over the editor's managed installation. If none is available, a matching official binary is offered for supported platforms and GHC versions.
The offer shows the compiler, version, release URL, download size and destination. Download and launch accepts this specific transfer; Not now or Escape downloads nothing. The checksum and compiler ABI are checked before installation.
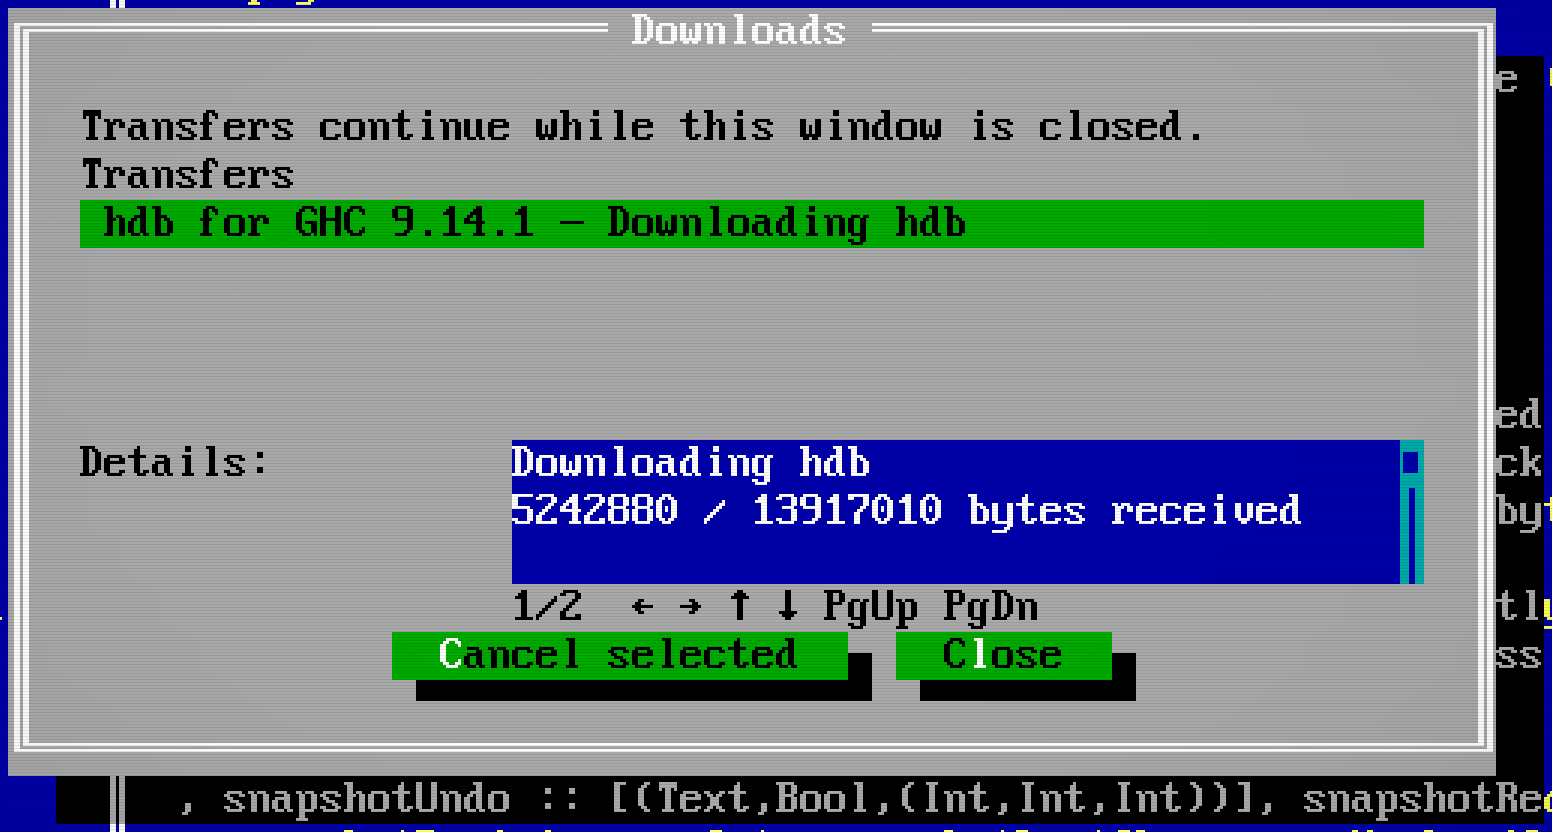
Tools > Downloads shows progress, received bytes and failures. Cancel selected stops a pending transfer; closing the window lets it continue. After installation, the accepted launch continues with its original source, project, arguments and port. Changing the source, project or compiler settings, starting another launch, or stopping the debugger invalidates that continuation. The installed tool remains available for a later launch. See Installation for the cache location and supported binary releases.
hdb uses that file's cradle/component and its own compiled-in GHC version. A customized GHC executable requires explicit Adapter config, so Selected target cannot silently substitute another compiler. Use Adapter config for a different entry point or additional GHC options.
Debugged programs that request a terminal open an ordinary Terminal window beside the source. Focus that window to type program input or send Ctrl+C; its output, colors, Unicode and resize behavior use the same terminal as Run. The terminal survives detaching and resuming the editor display. Debug > Disconnect ends the owned debugger and its terminal process, retaining the displayed output. Adapters that send output without a terminal use the live Debugger output window, also available through Debug > Output. This output view does not accept program input. The inspected hdb release disables terminal requests on Windows; that platform's program input remains unqualified.
Step through a program
- Launch or attach, then wait for the first stop. The editor opens the debugger's source and moves the caret to the stopped location.
- Press F7 to trace into the next operation, F8 to step over it, or Ctrl+F7 to return from the current frame. Each stop updates the source position; the status bar identifies the stopped frame.
- Open Debug > Call stack, select a frame and choose Open to visit its source. Use Debug > Scopes for values exposed by that adapter. Debug > Exceptions… chooses when to stop; Exception details shows the stopped exception, nested causes and stack when the adapter supports it.
- Press F4 to continue. Set a breakpoint with Ctrl+F8 when you want the program to stop at a source location instead of stepping all the way there.
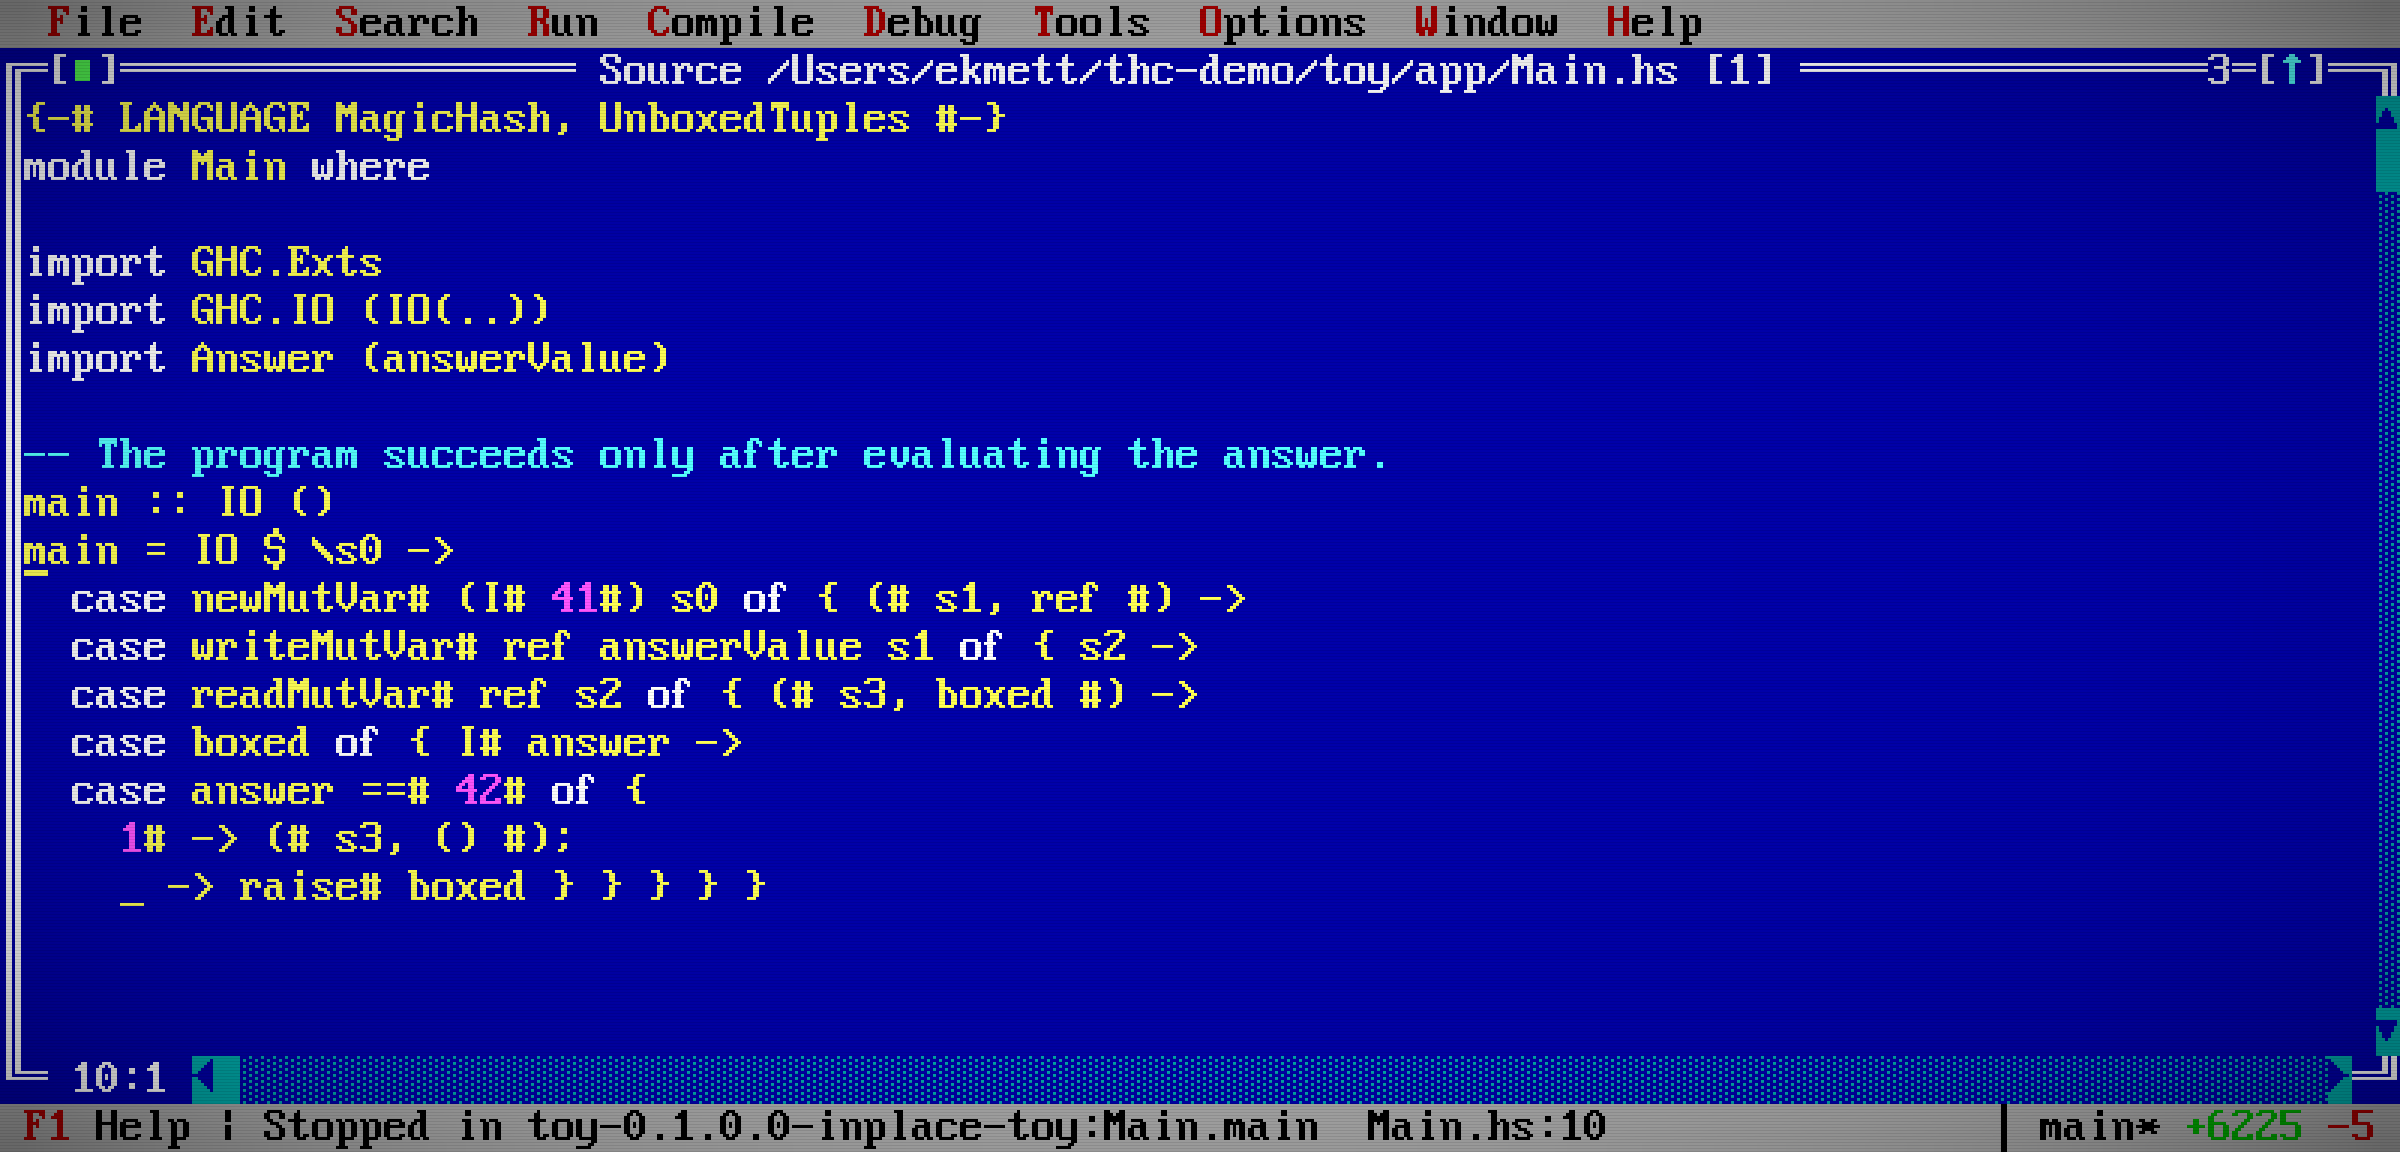
This is a live THC session running a small Haskell program. Its source is supplied by the debugger. The editor remains open on its own project; debugging a process does not require replacing the files already on your desktop.
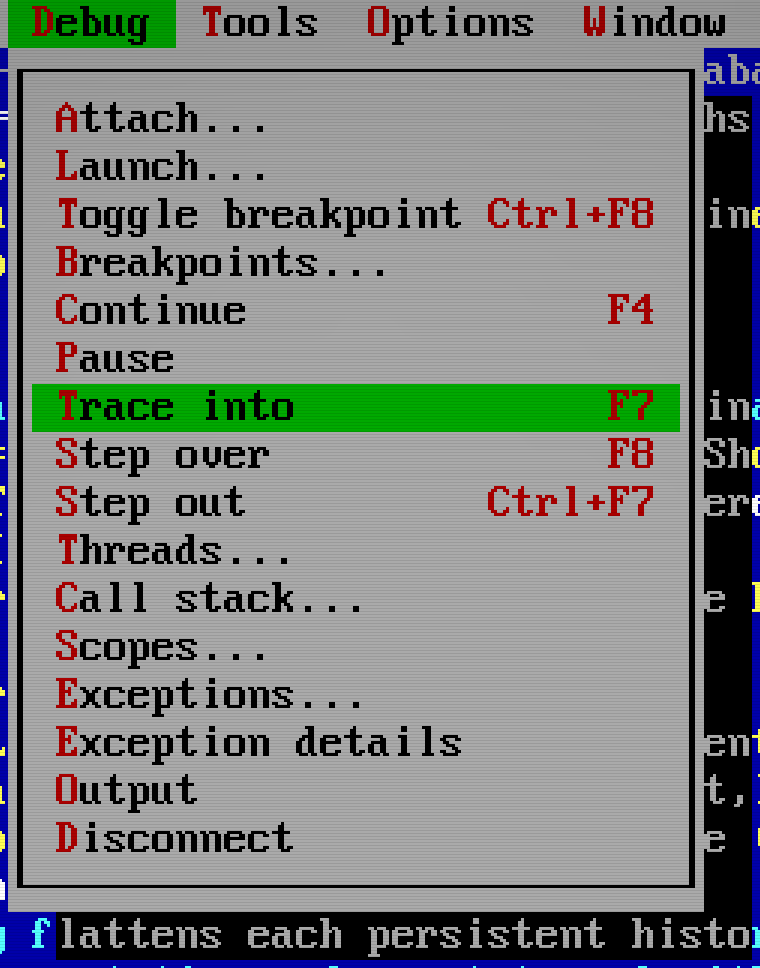
| Action | Keys or menu |
|---|---|
| Toggle a source breakpoint | Ctrl+F8 |
| List or remove breakpoints | Debug > Breakpoints |
| Continue | F4 |
| Pause | Debug > Pause |
| Trace into | F7 |
| Step over | F8 |
| Step out | Ctrl+F7 |
| Choose a thread | Debug > Threads |
| Inspect frames and variables | Debug > Call stack, then Scopes |
| Choose advertised exception filters | Debug > Exceptions |
| Read debugger output | Debug > Output |
| Disconnect | Debug > Disconnect |
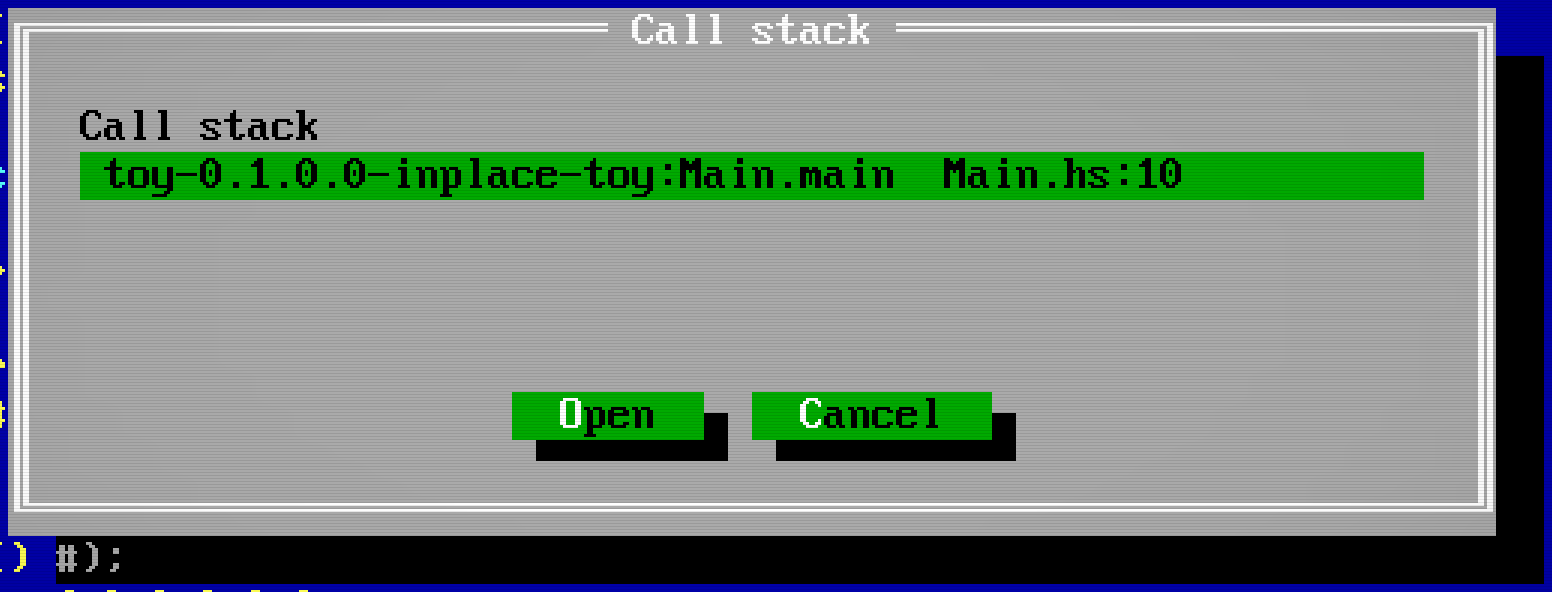
Choose a frame to inspect its scopes and expand variables explicitly. Values come from the runtime; the editor does not automatically evaluate expressions or change variables. Frame and variable selections expire when execution resumes. Source supplied by the server opens read-only if no disk file is available.
In a remote editor session, loopback is the remote host, so the debugger stays beside the running program.
Debugging with an agent
The conversation agent uses the same DAP session as the Debug menu. Its tools control the debugger directly and return structured results. Automatic source following starts enabled. The agent can set debug_present to follow: false to investigate without moving your source window at each stop, then reveal a source frame, stack, scopes or output view when there is something to show. Changing presentation does not resume or restart the program.
See debugging skills and the debugging operation reference.